Case Study: Atlantic City Getaway Planner
The Challenge:
The Atlantic City Business Alliance wanted to increase tourism by making it easier for visitors to plan spontaneous trips. They also wanted to change the public’s perception of Atlantic City from a gambling mecca to an oceanside vacation resort which offers world class cuisine, lodging, and entertainment.
My Role:
I was the UX lead on a small team of 2 designers, a project manager, and 2 developers.
The Outcome:
A responsive web-enabled trip configurator, powered by a personalized recommendation engine. The intuitive interface connected to social media. Number of trips increased as did average duration of stay.
Lessons learned
Rapid usability improvements come from frequent small usability tests, and collaborative ideation on the results. A “mobile first” approach can aid in organizing a complex tool.
Background
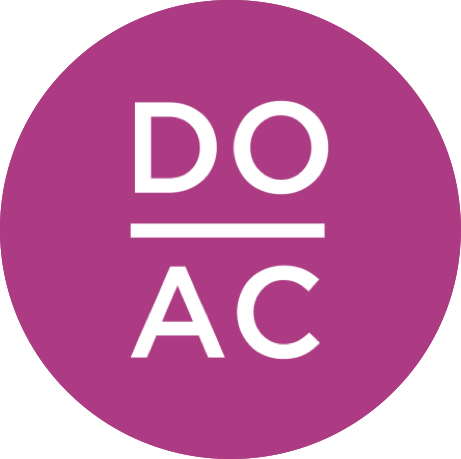
The Atlantic City Tourism Board had a problem. Surveys showed that people viewed their city as dominated by gambling interests, which was keeping casual visitors and families away. The city has many other attractions: a great beach with a famous boardwalk, world-class cuisine, 4-star hotels, concerts, events, and other activities. “Do AC”, a publicity campaign, was created to raise awareness of all Atlantic City had to offer.
Another issue facing the business community was that the measurement “time spent per visit” was low compared to other destinations: only 14 hours. Finally the board wanted to promote spontaneous trips to Atlantic City, for example, a spur-of-the moment weekend trip thrown together on a Friday.
An online tool was needed that would do all this.
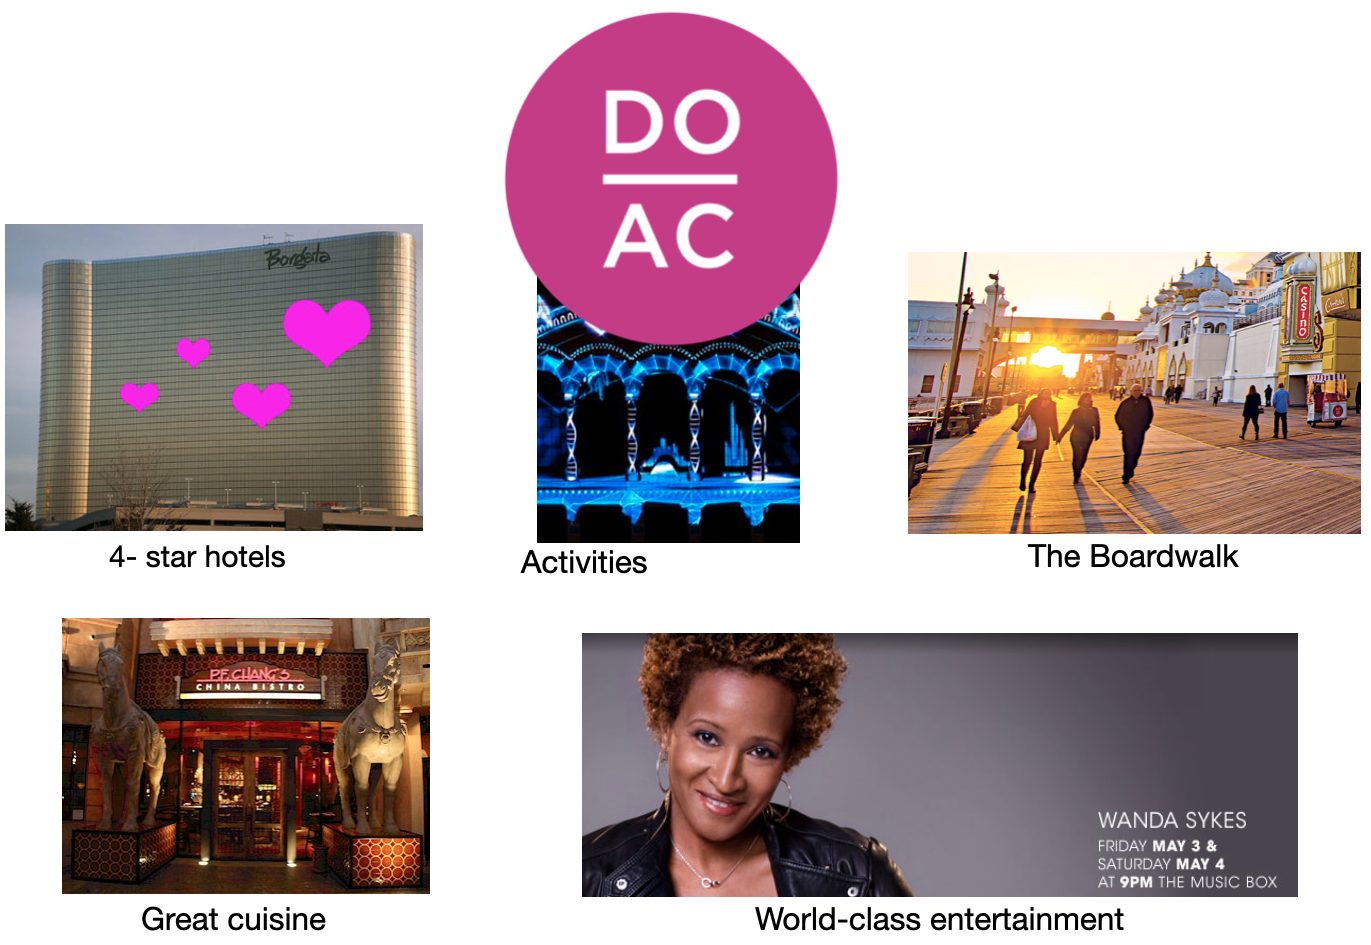
Existing site
Atlantic City already had a website with a very basic planning tool, however there were some problems:
Discovery
This project did not have a big budget, so we couldn’t have an in-depth Discovery process. Instead we needed a Lean approach: find out basic user needs, quickly design and prototype, test frequently, and iterate. We began to gather information about users.
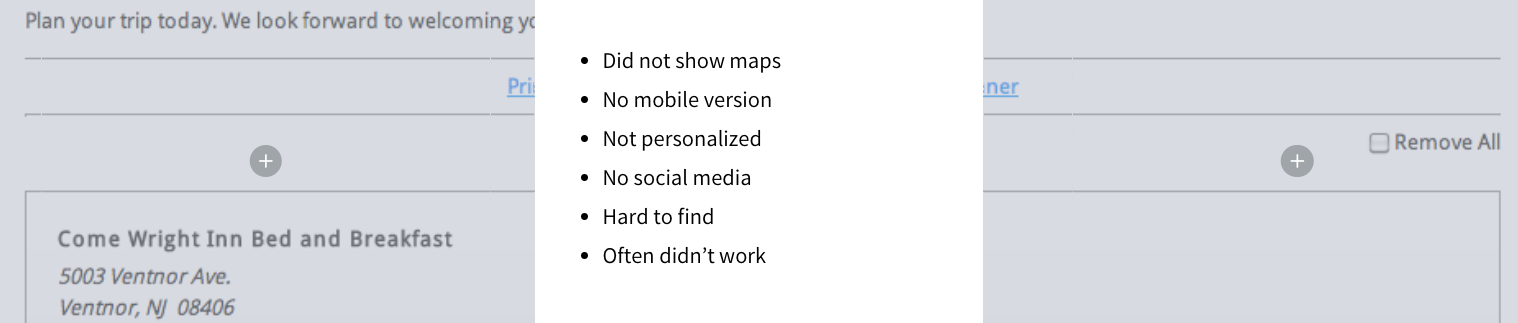
Diagram of the iterative design and critique process. Warfel, Todd Zaki. 2009. Prototyping: A Practitioner’s Guide. New York: Rosenfeld Media.

User Research methods
Web survey and ground level interviews with Atlantic City visitors
Findings
Users top needs:
- Book a hotel
- Learn about entertainment options
- Find restaurants
- Get information on local events
We were contracted to develop a trip configurator with a personalized recommendation engine. This would help different types of users book the exact trip they wanted.
To produce meaningful results, the engine required categories that went beyond the basics for a resort area: restaurants, hotels, events, etc., finer-grained subcategories were needed. For example, what criteria would someone use to pick a hotel?
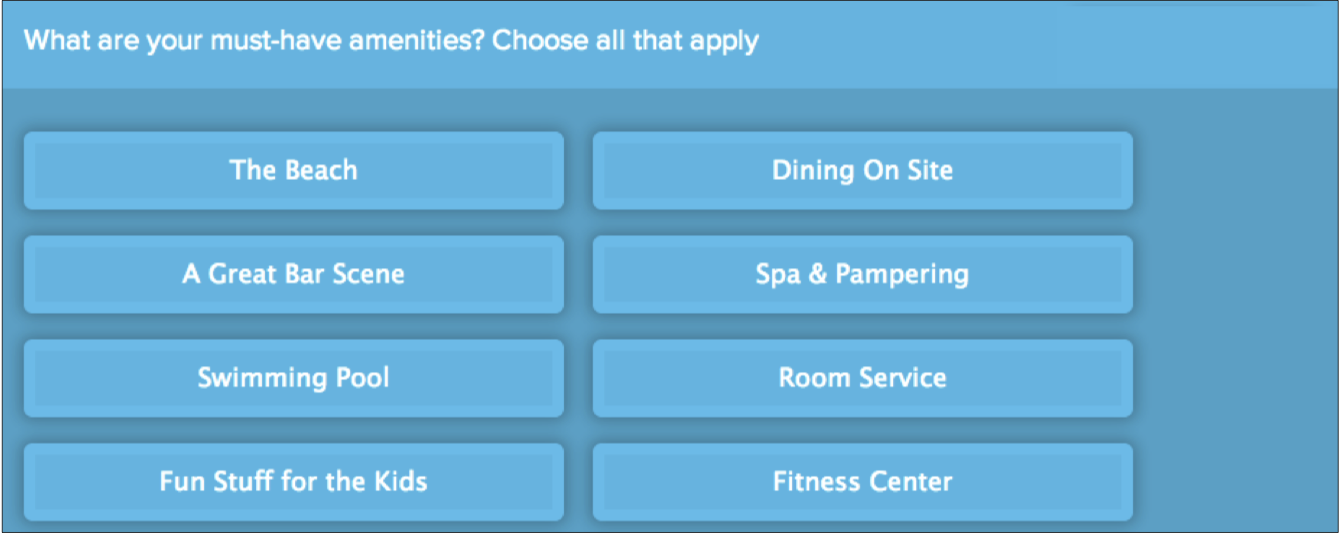
Fortunately this type of categorization was something the Business Alliance had been creating for several years. Businesses would self-assess categories and send results to the Alliance, who vetted them and created a database “tagging” the businesses with subcatagories, for example “kid-friendly”. This was a big effort and not something our small team could have done on our own.
Comparator/Competitor
Part of Discovery was learning about digital solutions that were already on the market. None were taking full advantage of the mobile form factor.
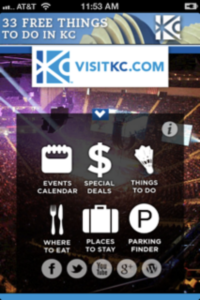
Unclear workflow, not sized correctly for mobile
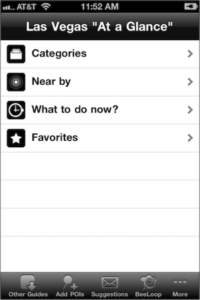
Underdesigned, too much hidden by trays
Cluttered, poor affordance
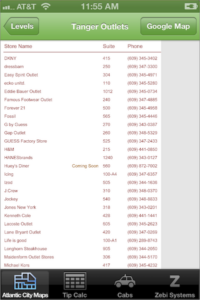
Not optimized for mobile.
Define
We used user storymapping to break down user needs into tasks and subtasks. The “Define” stage never stopped: prototyping and user testing would reveal missed opportunities and better ways to implement features.
Storymapping revealed the scope of desired functionality. Storymapping-derived user tasks translated into to features. Unexpected feature opportunities emerged, one of which was a weather “bug” to go along with outdoor event listings.
The process of mapping tasks roughly delineated the order in which they would occur, which informed how functionality should be layered. For example, although a user could start a trip by selecting a hotel or an event, they would probably not want to share anything to social media until after they clicked “Save my trip”.
Mobile first
It made sense that a trip configurator would primarily be viewed on a mobile device. Even if originally created on a desktop, users would be referring to their smartphone or tablet for details during the trip. Our goal was to make a full-featured configurator for mobile.
Prototype and Test
Creating a trip plan requires many steps, a balance needed to be struck between holding the user’s hand through a defined process – a sort of “Turbotax” model – versus letting them do what they wanted, when they wanted.
I leaned towards user freedom. A pre-defined step-by-step model like TurboTax works best for a defined set of tasks, done in a prescribed order, like…well… filling out tax forms. A trip plan is more flexible, the end result is whatever the user wants it to be. Enforcing a proscribed process makes it more difficult to create “nonstandard” trips. Let’s say we have a linear process with some flexibility built in. The user decides to customize and selects “skip this step” in the process several times. To go back into that wizard-like process and add steps back in is more difficult than navigating through a “select anything, at anytime” interface.
One might think a flexible interface would make wayfinding more difficult, after all, what’s easier than finding your way along a linear progress bar? However the user is not always at the top level of the process. They might be tunneled into a subroutine, and then remember they need to edit a previous step, which is going to change their options on a subsequent step.
The key to good wayfinding in a flexible system is to make “visibility of system status” primary, and to keep the user at most a few clicks from a full overview. It’s possible that the right type of progress bar, including sub-steps would achieve this, however this would be awkward on a small viewport. Given, as argued before, everyone will have a different progress bar, why not make the entire interface an indicator of overall trip status?
I know users need a degree of hand-holding, but this could provided this via accelerators and system checks. Let’s see how this all fit together:
Hub-and-spoke pattern
Recall the visual confusion in the mobile examples I showed before. To avoid this I create a very simple splash screen, one that lead to a central hub from which the user could make selections in any order.
The logged-in splash page is Google-like in it’s simplicity. Few options with a clear call-to-action.
Date capture serves two functions: it creates a default trip name (which can be changed), and it enables error prevention should a user attempt to make reservations outside their stated date range.
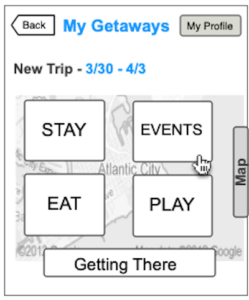
The trip planner screen lets a user start their plan from any category. This screen also functions as a trip status indicator.
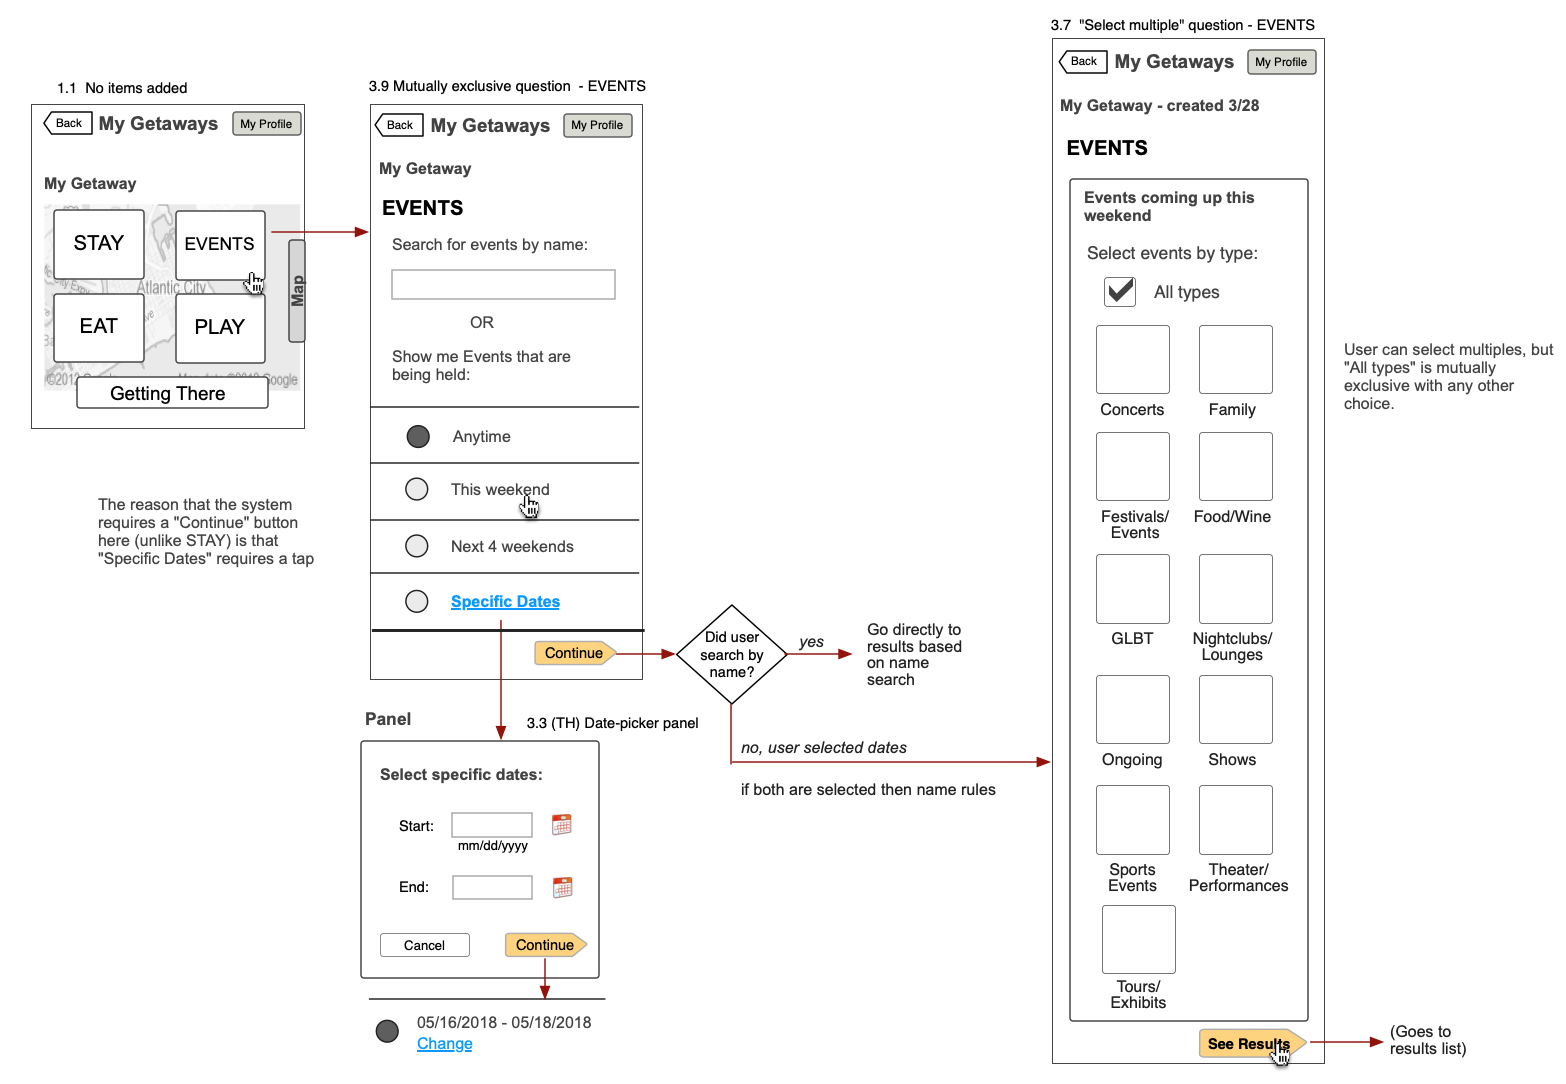
From here the user can complete various tasks by traveling down one of the spokes, the workflows, in this case buying tickets to an event. At any time they can reverse their actions and return to the hub.
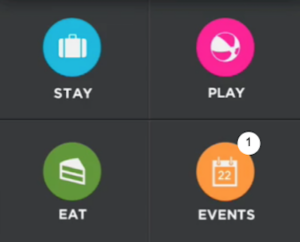
Upon task completion, the system has returned the user to the main screen, now with a bubble numeral indicating that an event has been booked. From here they can select any other option. The screen is functioning both as a workspace and a readout.
 Main view (with design)
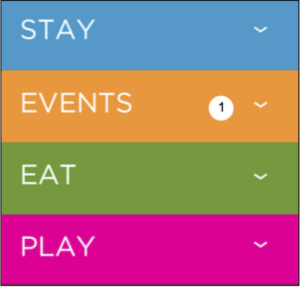 List view (with design)
User testing, feedback, and iteration
I created a mobile prototype and we began user testing. It immediately became apparent that users had trouble finding the map.
The original design had a tab on the right side of the trip overview screen. Dragging it to the left invoked the map.
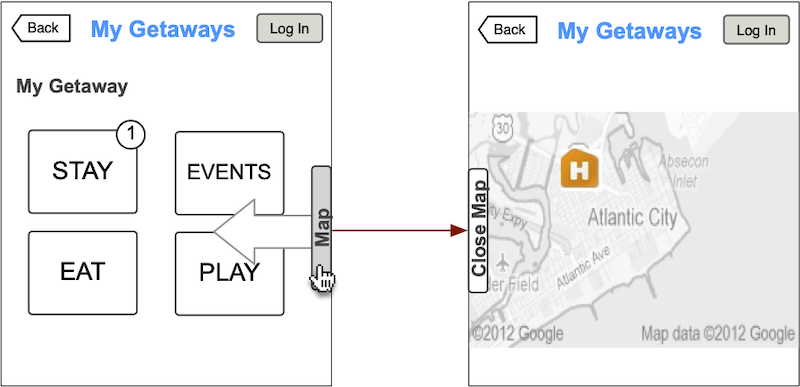
 Users could not find the map.
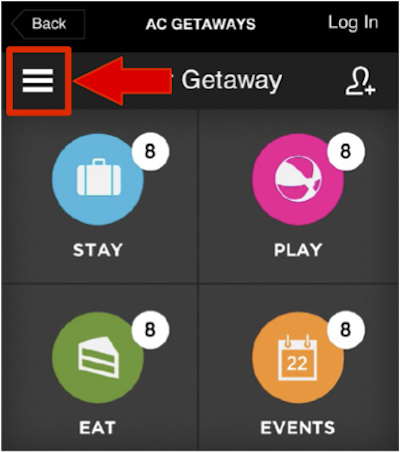
We met as a group to iterate. The next ideas was to place the map mode toggle in a “hamburger” menu.
 Users could still not find the map.
We met again. This time our project manager suggested that we create an always visible button in a top-menu. This would be a more traditional approach and not be hidden behind a hamburger menu.
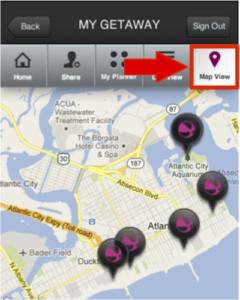
Success! Users could easily find the map.
Turbocharging the tool based on additonal user feedback
Conversations with users during testing revealed opportunities to speed up planning and make the experience more pleasant.

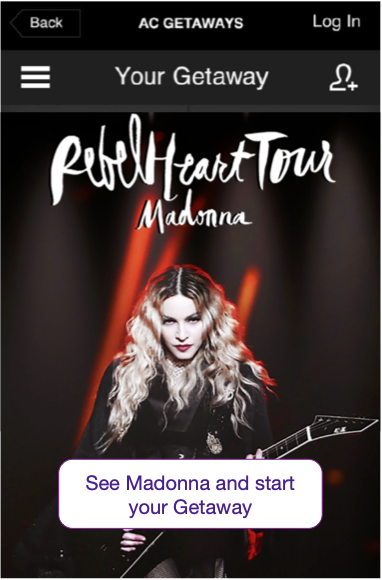
Focusing on events
Users told us they often anchored trips to a concert or other big event. This provided an opportunity on the splash screen for sponsorship, provisioned fresh content, and gave users a focal point to start their trip.
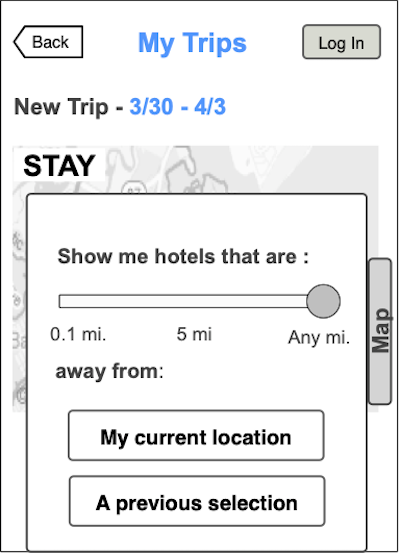
Saving shoe leather and cab fare
Atlantic City hotels and casinos are spread out, and not all of them are on the main strip. Users preferred trips where their lodging and destinations were clustered. To enable this, we provided distance filters for search, based both on distance from a previous selection, and from the users current geolocation. This helped users to make smart choices, even while already on the trip.
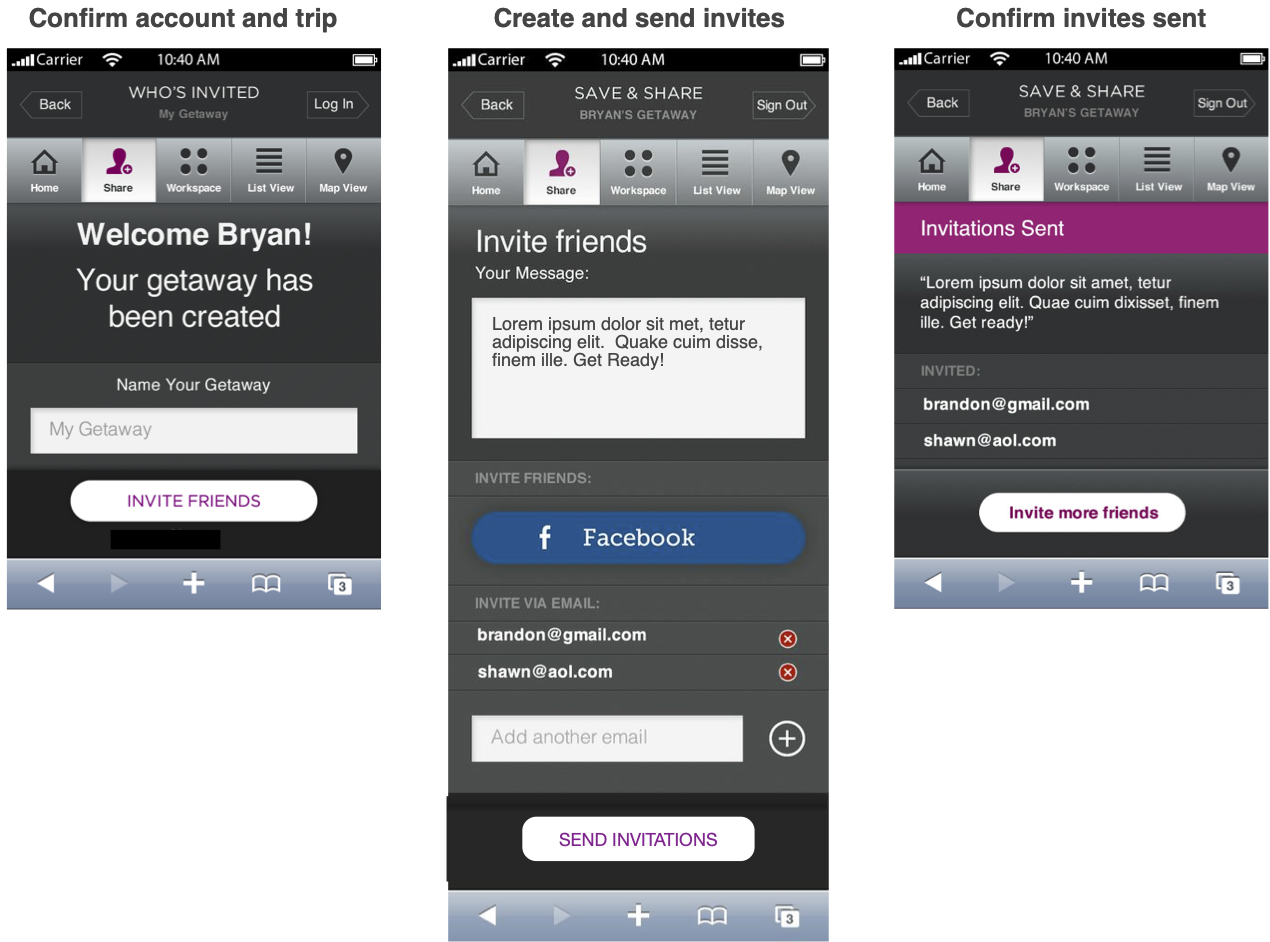
The more the merrier
Upon completion of a trip plan, users were encouraged to invite friends along either by email address or via Facebook. Invitees were sent a message and detailed trip inventory. Users could also post a short general announcement to their Facebook wall without specific information .
Results
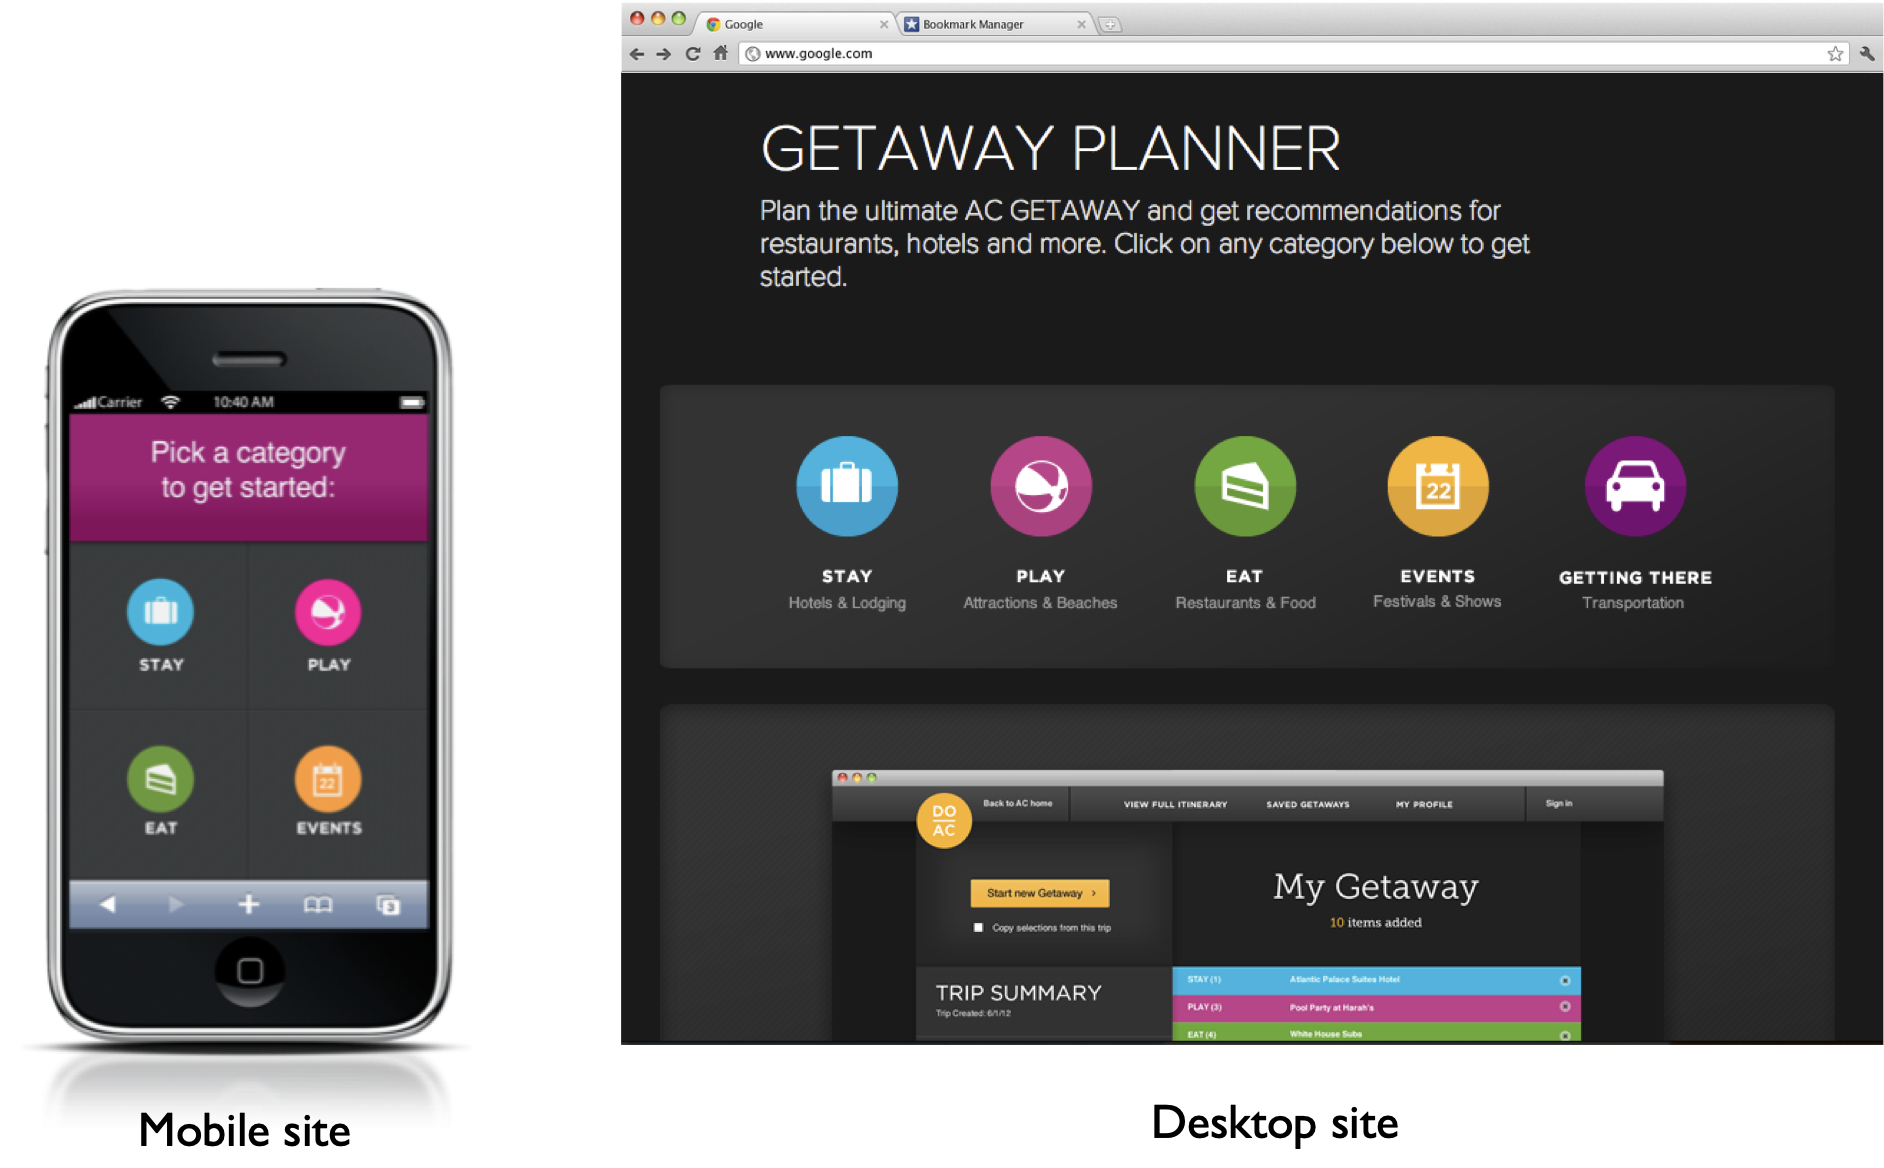
The Atlantic City Getaway Planner was released in both mobile and desktop versions.
- Respondent’s “intent to visit” increased 21%.
-
Atlantic City received a higher degree of awareness in several key categories: “a great getaway all-year round” and for “a variety of appealing activities” and “offers more than just gambling.”
-
Aggregate number of trips increased as did average duration of stay.
The Casino Reinvestment Development Authority. All Rights Reserved.
The CRDA is accredited by the Destination Marketing Accreditation Program (DMAP) of DMAI.
Click the “play” button to see a short video of the trip configurator in action.
Lessons Learned

A trip configurator requires so many interactions and user paths that I initially thought it would be a challenge for even a full-sized website to accommodate it. I couldn’t imagine it working on a mobile phone.
By the end I learned that going “mobile first” made the design process easier. If I had started with a full desktop, the temptation would have been to add functionality next to functionality, and sort it out later. Mobile forced my hand. The economy required by the small screen essentialized the features. What are the 4 or 5 most important tasks? Don’t give equal prominence or visual weight to less important tasks. When it came to creating the desktop version, I felt I had too much room!
The tight timeline forced a “lean” approach. The simplest way I have heard “lean UX” described is “Make –> Check–> Think”. Prior to “Make” there is discovery of course, and on this project I benefitted from the initial categorization work that had been done by the Atlantic City Business Alliance.
The “lean” approach values collaboration, and this was confirmed when one of the best ideas on this project, how to make the map mode easier to find, came from our project manager.
I was grateful for Nielsen-Norman’s finding that usability studies can be done with as few as 5 users.
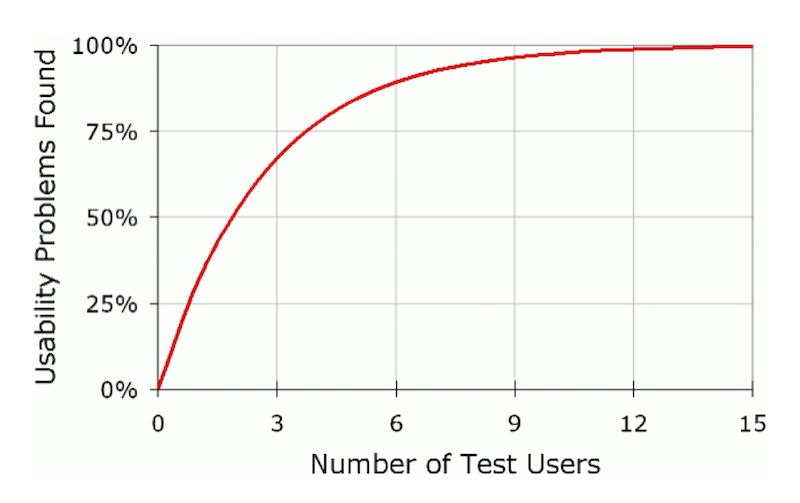
There was simply no time to be scheduling appointments with user testing candidates and writing up reports – this was “get out of your chair and run somebody down” usability. This allowed for more iteration cycles, and gave us a sense of progress.
Finally, I experienced something I might call “emotional design-ing”. Similar to the concept of “emotional design” where end-users report a more positive overall user experience when they are delighted by a design (my unproven theory is that this also reduces abandonment). I found that the beautiful comps created by the visual designers, although not making me any smarter, gave me a better “builder experience”: a positive feeling that we were building something worthwhile together.
More Case Studies
Also see my traditional Work Samples
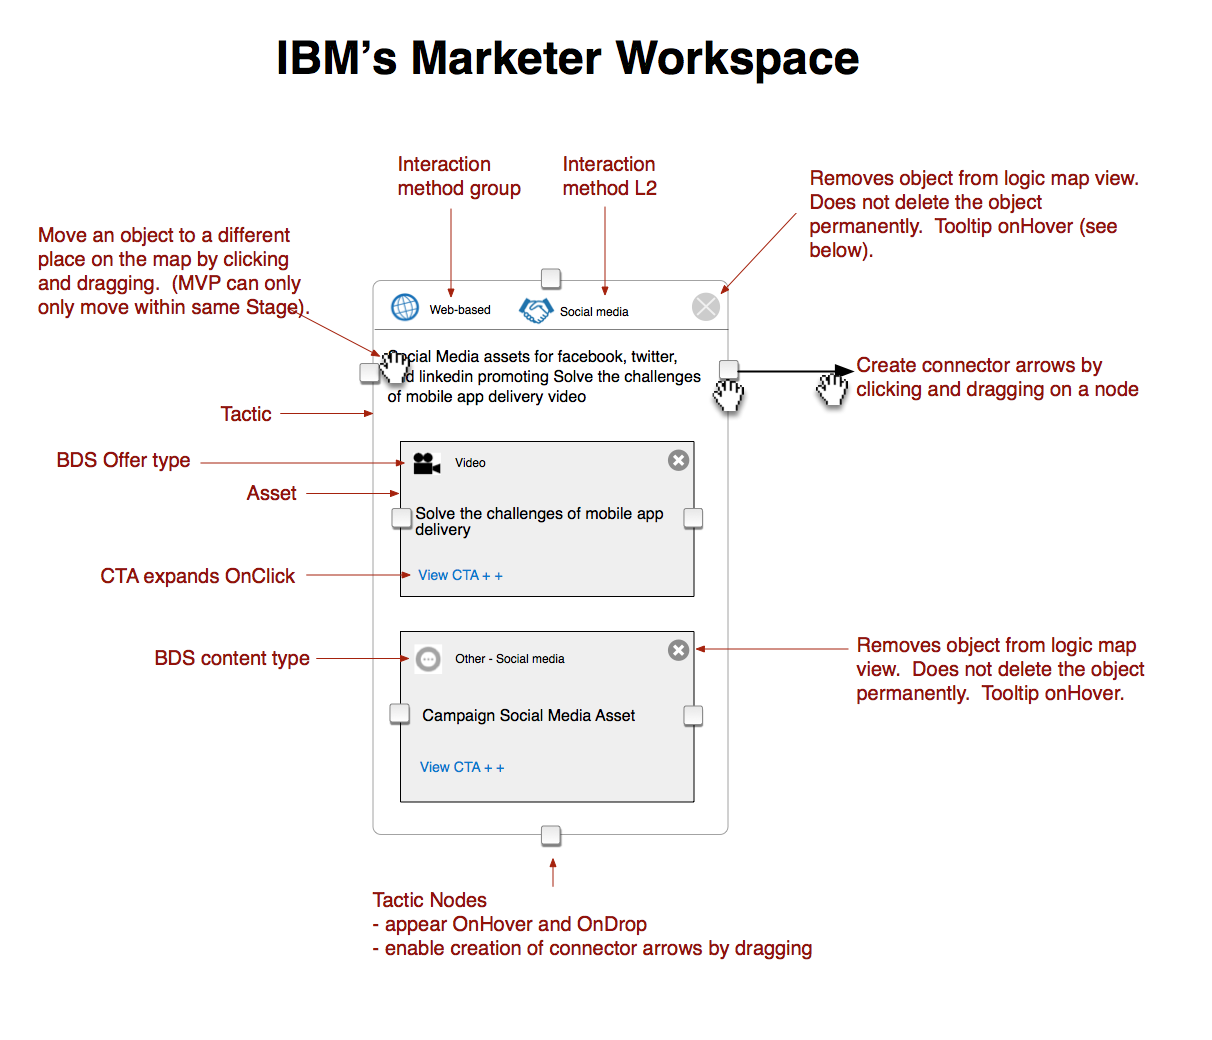
Case Study: Marketing Campaign Management platform
IBM finally recognizes its most-neglected user, the IBM employee.
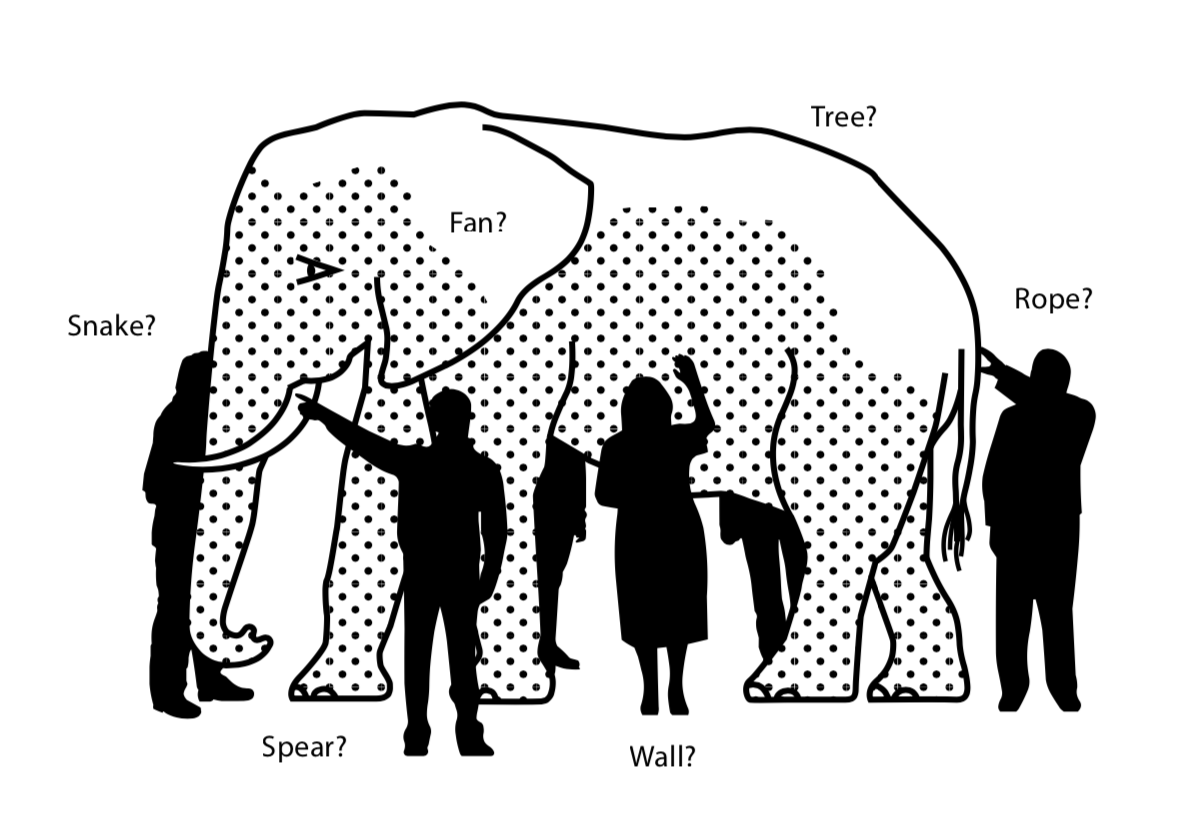
Case study: The Dual Role of UX in the Discovery of Complex Systems
Using UX skills to give your team an overview of a complex system will enhance shared understanding and open up new areas of discovery.